Why I built it
I wanted to see whether I could take open transport data, build a model of a metro system and make it something I could explore.
It also gave me a reason to return to the network ideas I used during my PhD research. The subject is different, but the questions feel familiar: how places connect, where transfers matter and what a network’s structure can tell us.
Beijing was the starting point. The broader aim is to make the approach reusable, so adding another city becomes a question of adapting the data rather than starting the whole project again.
Building the network
The project brings together OpenStreetMap data, transport information and a simulated timetable. Stations and their connections form the network, while the service model adds a way to explore journeys and interchanges.
Part of the work was getting the geography and network structure to agree. A station on a map is one thing; representing how it connects to other stations and lines is another.
Why simulate services?
A map shows where the lines go, but not necessarily how a journey works. Adding simulated services lets me explore the network beyond its shape.
It also makes the assumptions part of the model. The timetable is simulated rather than a live feed, so it is a way to experiment with the network rather than check the next departure.
Making it reusable
The part I’m most interested in is whether the same approach can carry over to another city. I want the shared modelling work to stay separate from city-specific data and settings. That makes it easier to compare networks and gives me a practical reason to think about how the code is organised.
What I enjoyed
This was a chance to combine network analysis with something visual and interactive. It connects back to my research interests, while giving me room to experiment with a different kind of application.
There is also something enjoyable about turning a familiar metro map into a model you can question, change and explore.
Current direction
Beijing is the starting point. The next step is to see what needs to change when the same approach is applied to another city, and which assumptions turn out to be less general than they first appeared.
The moving trains
The timetable is generated rather than taken from a live feed. The dataset generator uses simple service windows: different headways by time of day, a 25-second dwell time, and 110 seconds between consecutive stops.
That gives a modelled day you can poke around in the browser. It doesn't match real train movements, live headways, or passenger crowds. The animation is just a visual check on the network model, not proof of realistic operations.
Connections and interchange indicators
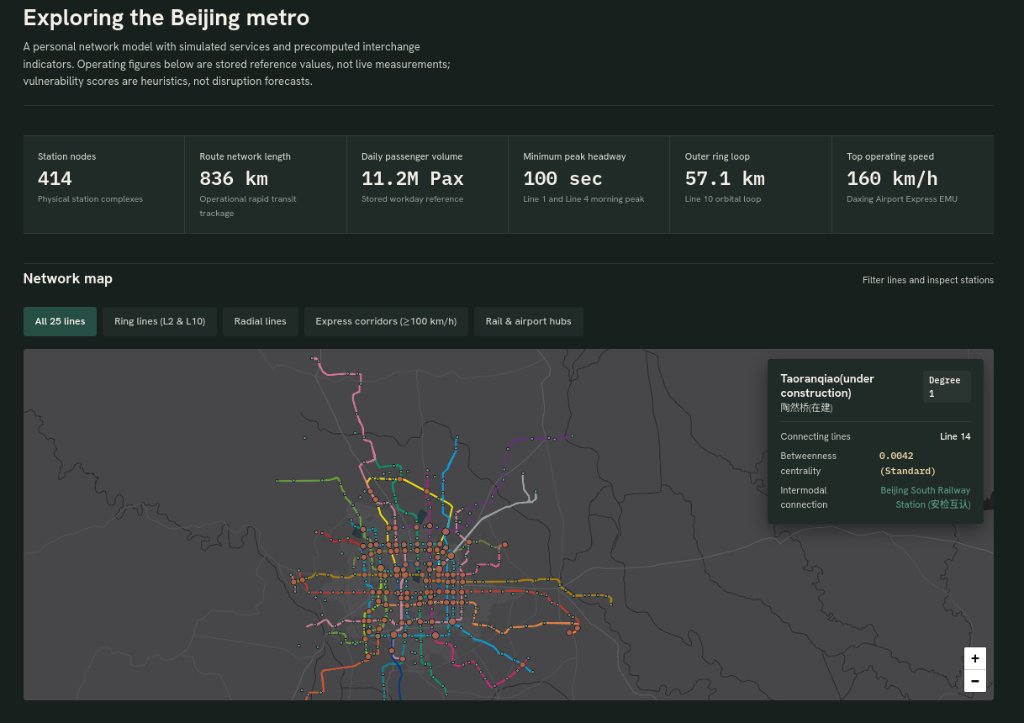
The network metrics look at degree and betweenness centrality. Degree counts direct connections; betweenness tracks how often a station sits on the shortest path between any two points.
The dashboard’s interchange panel displays precomputed numbers from the bundle. The vulnerability score is a rough heuristic combining line count and centrality. It's not a live re-routing simulation or a delay forecast if a station shuts.
What the model leaves out
A station-level graph ignores walking transfers inside big stations. And the generated timetable doesn't reflect track maintenance, delays, crowded platforms, or short-turned trains.
Some numbers in the generator are placeholder reference values. They'd need real-world verification before using them to evaluate actual transit performance. I've focused the notes here on what the code actually does.
Building this was a practical way to test graph ideas and see how well the data holds together. Having a working map is always a good push to get the data cleaned up.
Files behind the demo
The project repository is private. These paths identify the source and published data for readers with access:
web/generate_24h_gtfs.pyprepares the browser dataset.web/data/beijing_bundle.jsonholds geometry, simulated trips and network indicators.web/js/app.jscontains the simulation interface.web/js/analytics.jsdisplays the network analysis.
Continue reading / Related work